
Barrel files, wildcard imports, and deep-relative paths can keep your CI pipeline in the red no matter how smart your Nx/Bazel/Turborepo cache is. This guide shows you how to detect five high-impact “build-bloat” smells, track their burndown in Codemod Insights, and reclaim double-digit minutes from every build—without touching your build-tool flags.
Nx’s affected:build, Bazel’s remote cache, and Turborepo’s hashing are great at skipping work, but they trust that your source tree is lean.
Code patterns that balloon dependency graphs—barrel re-exports, wildcard imports, fixtures living in src/—force “clean” rebuilds even when nothing meaningful changed.
- Grab today’s CI average
Loading code sample...
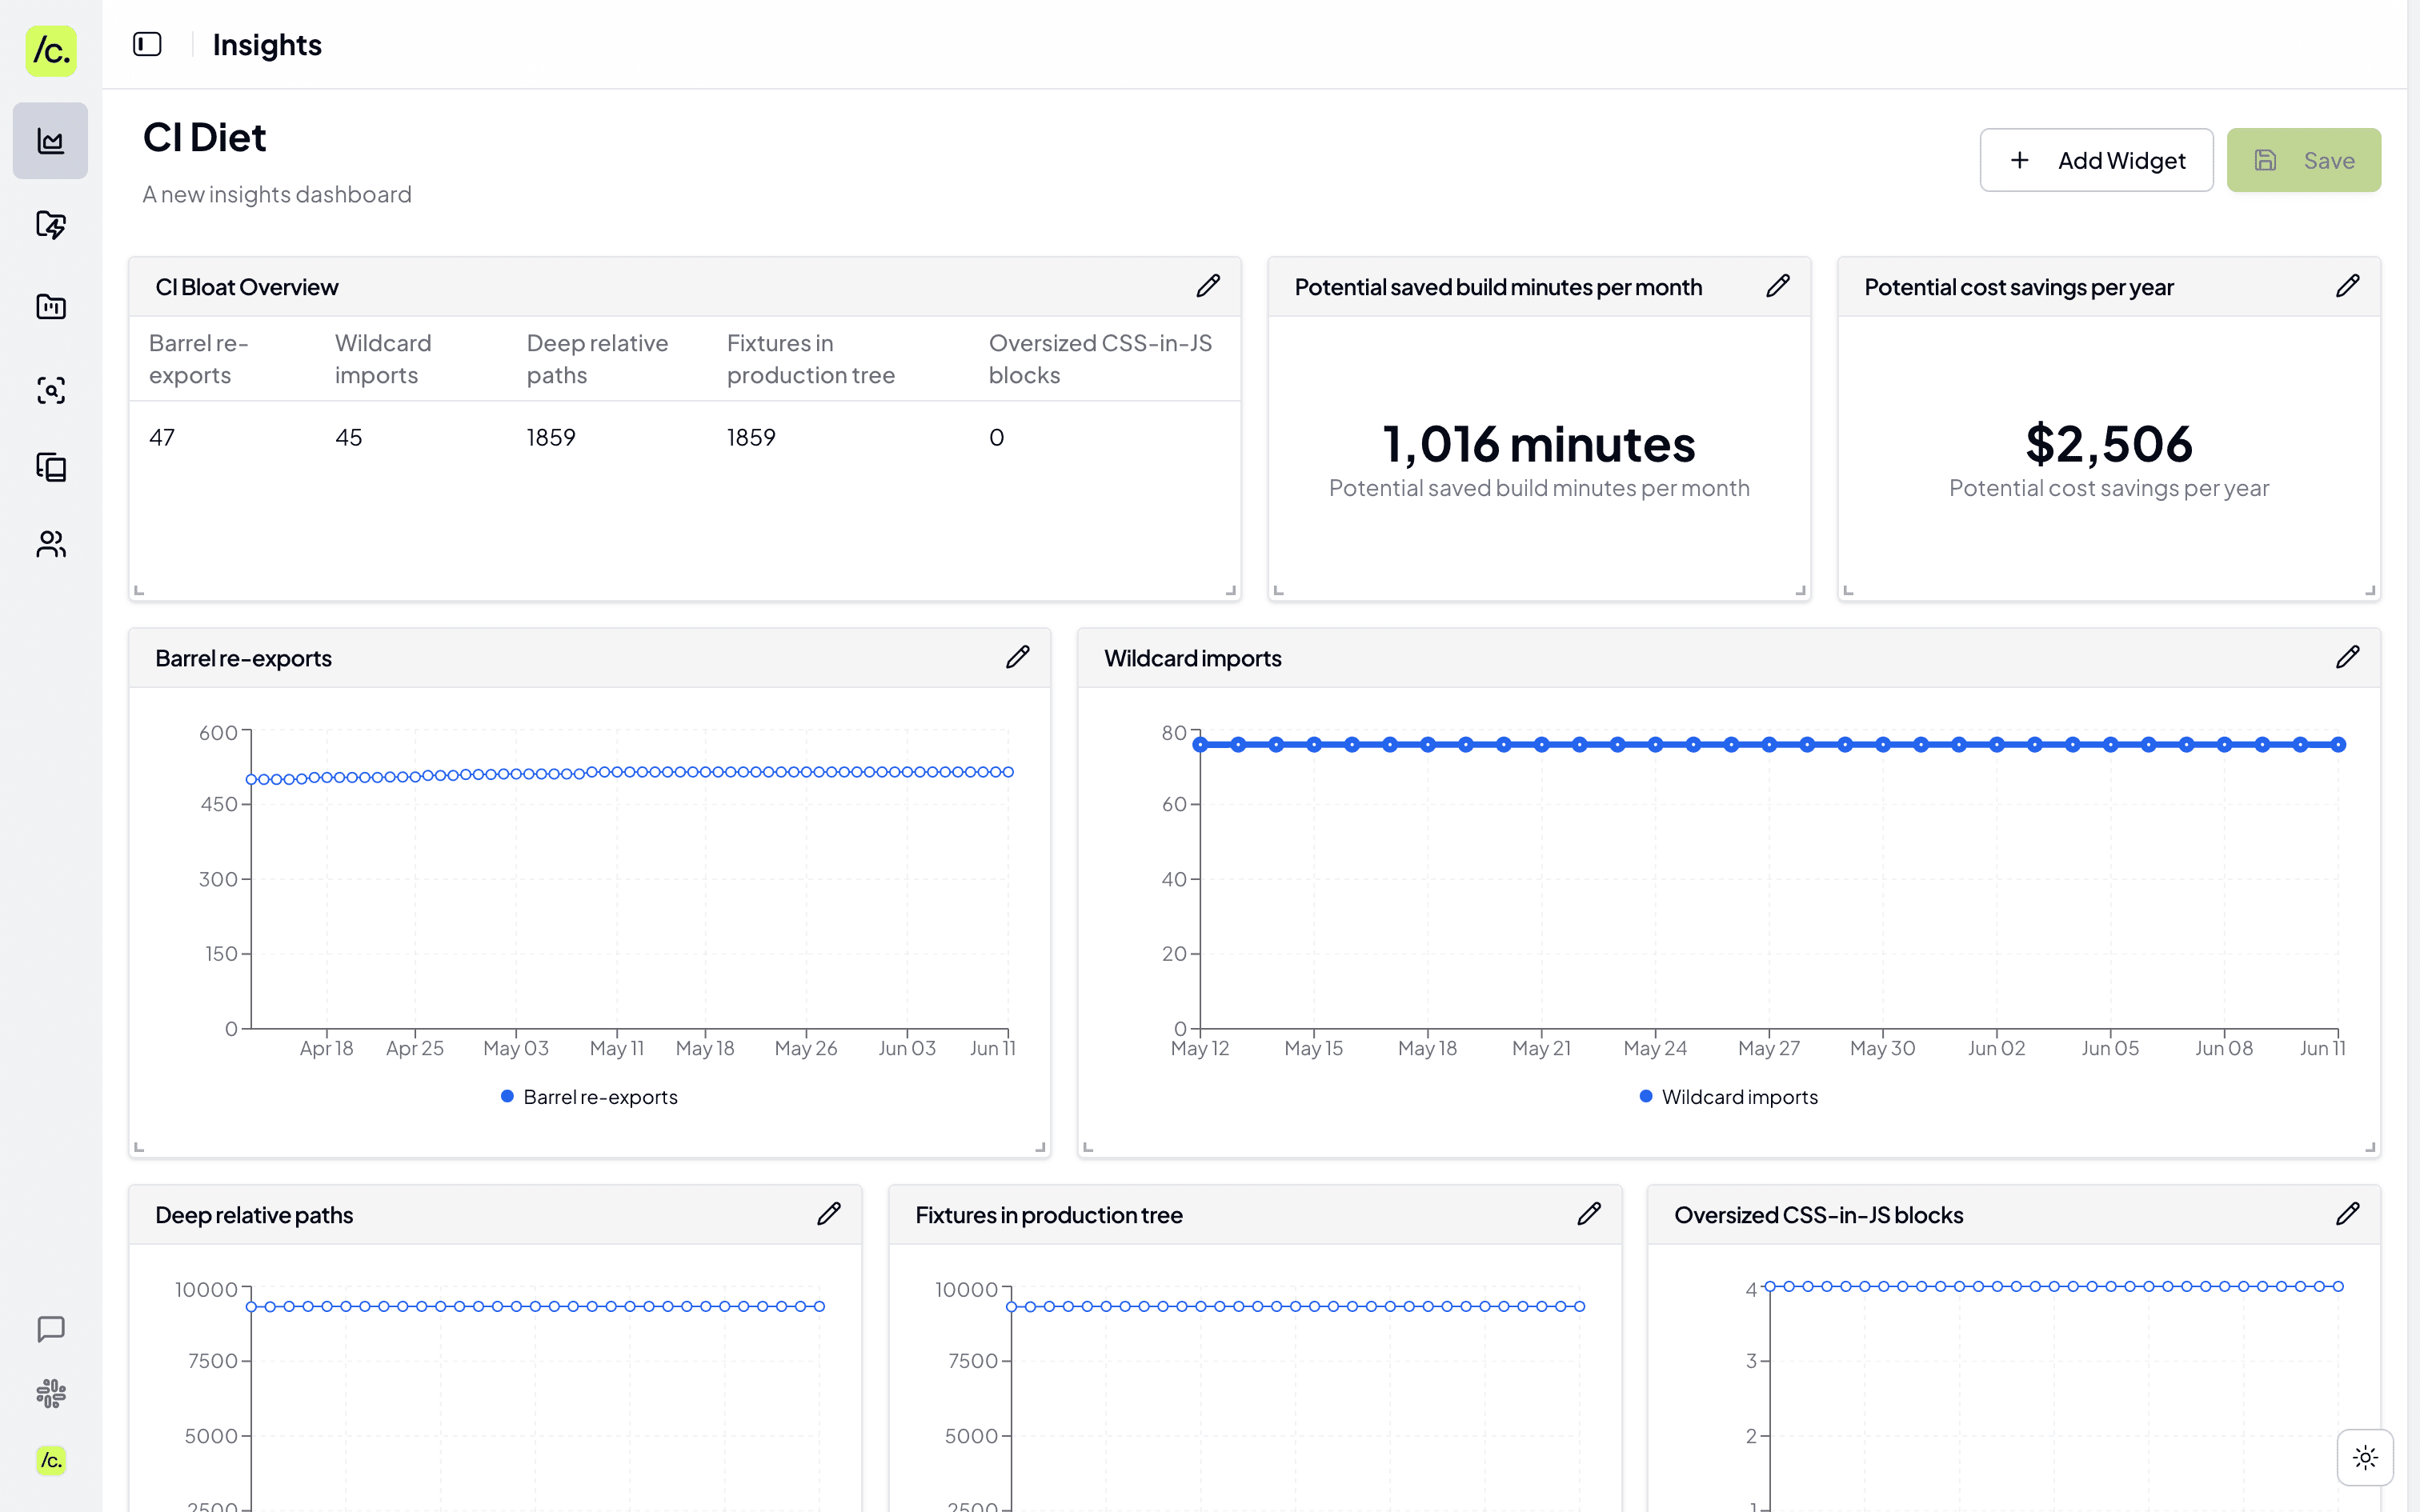
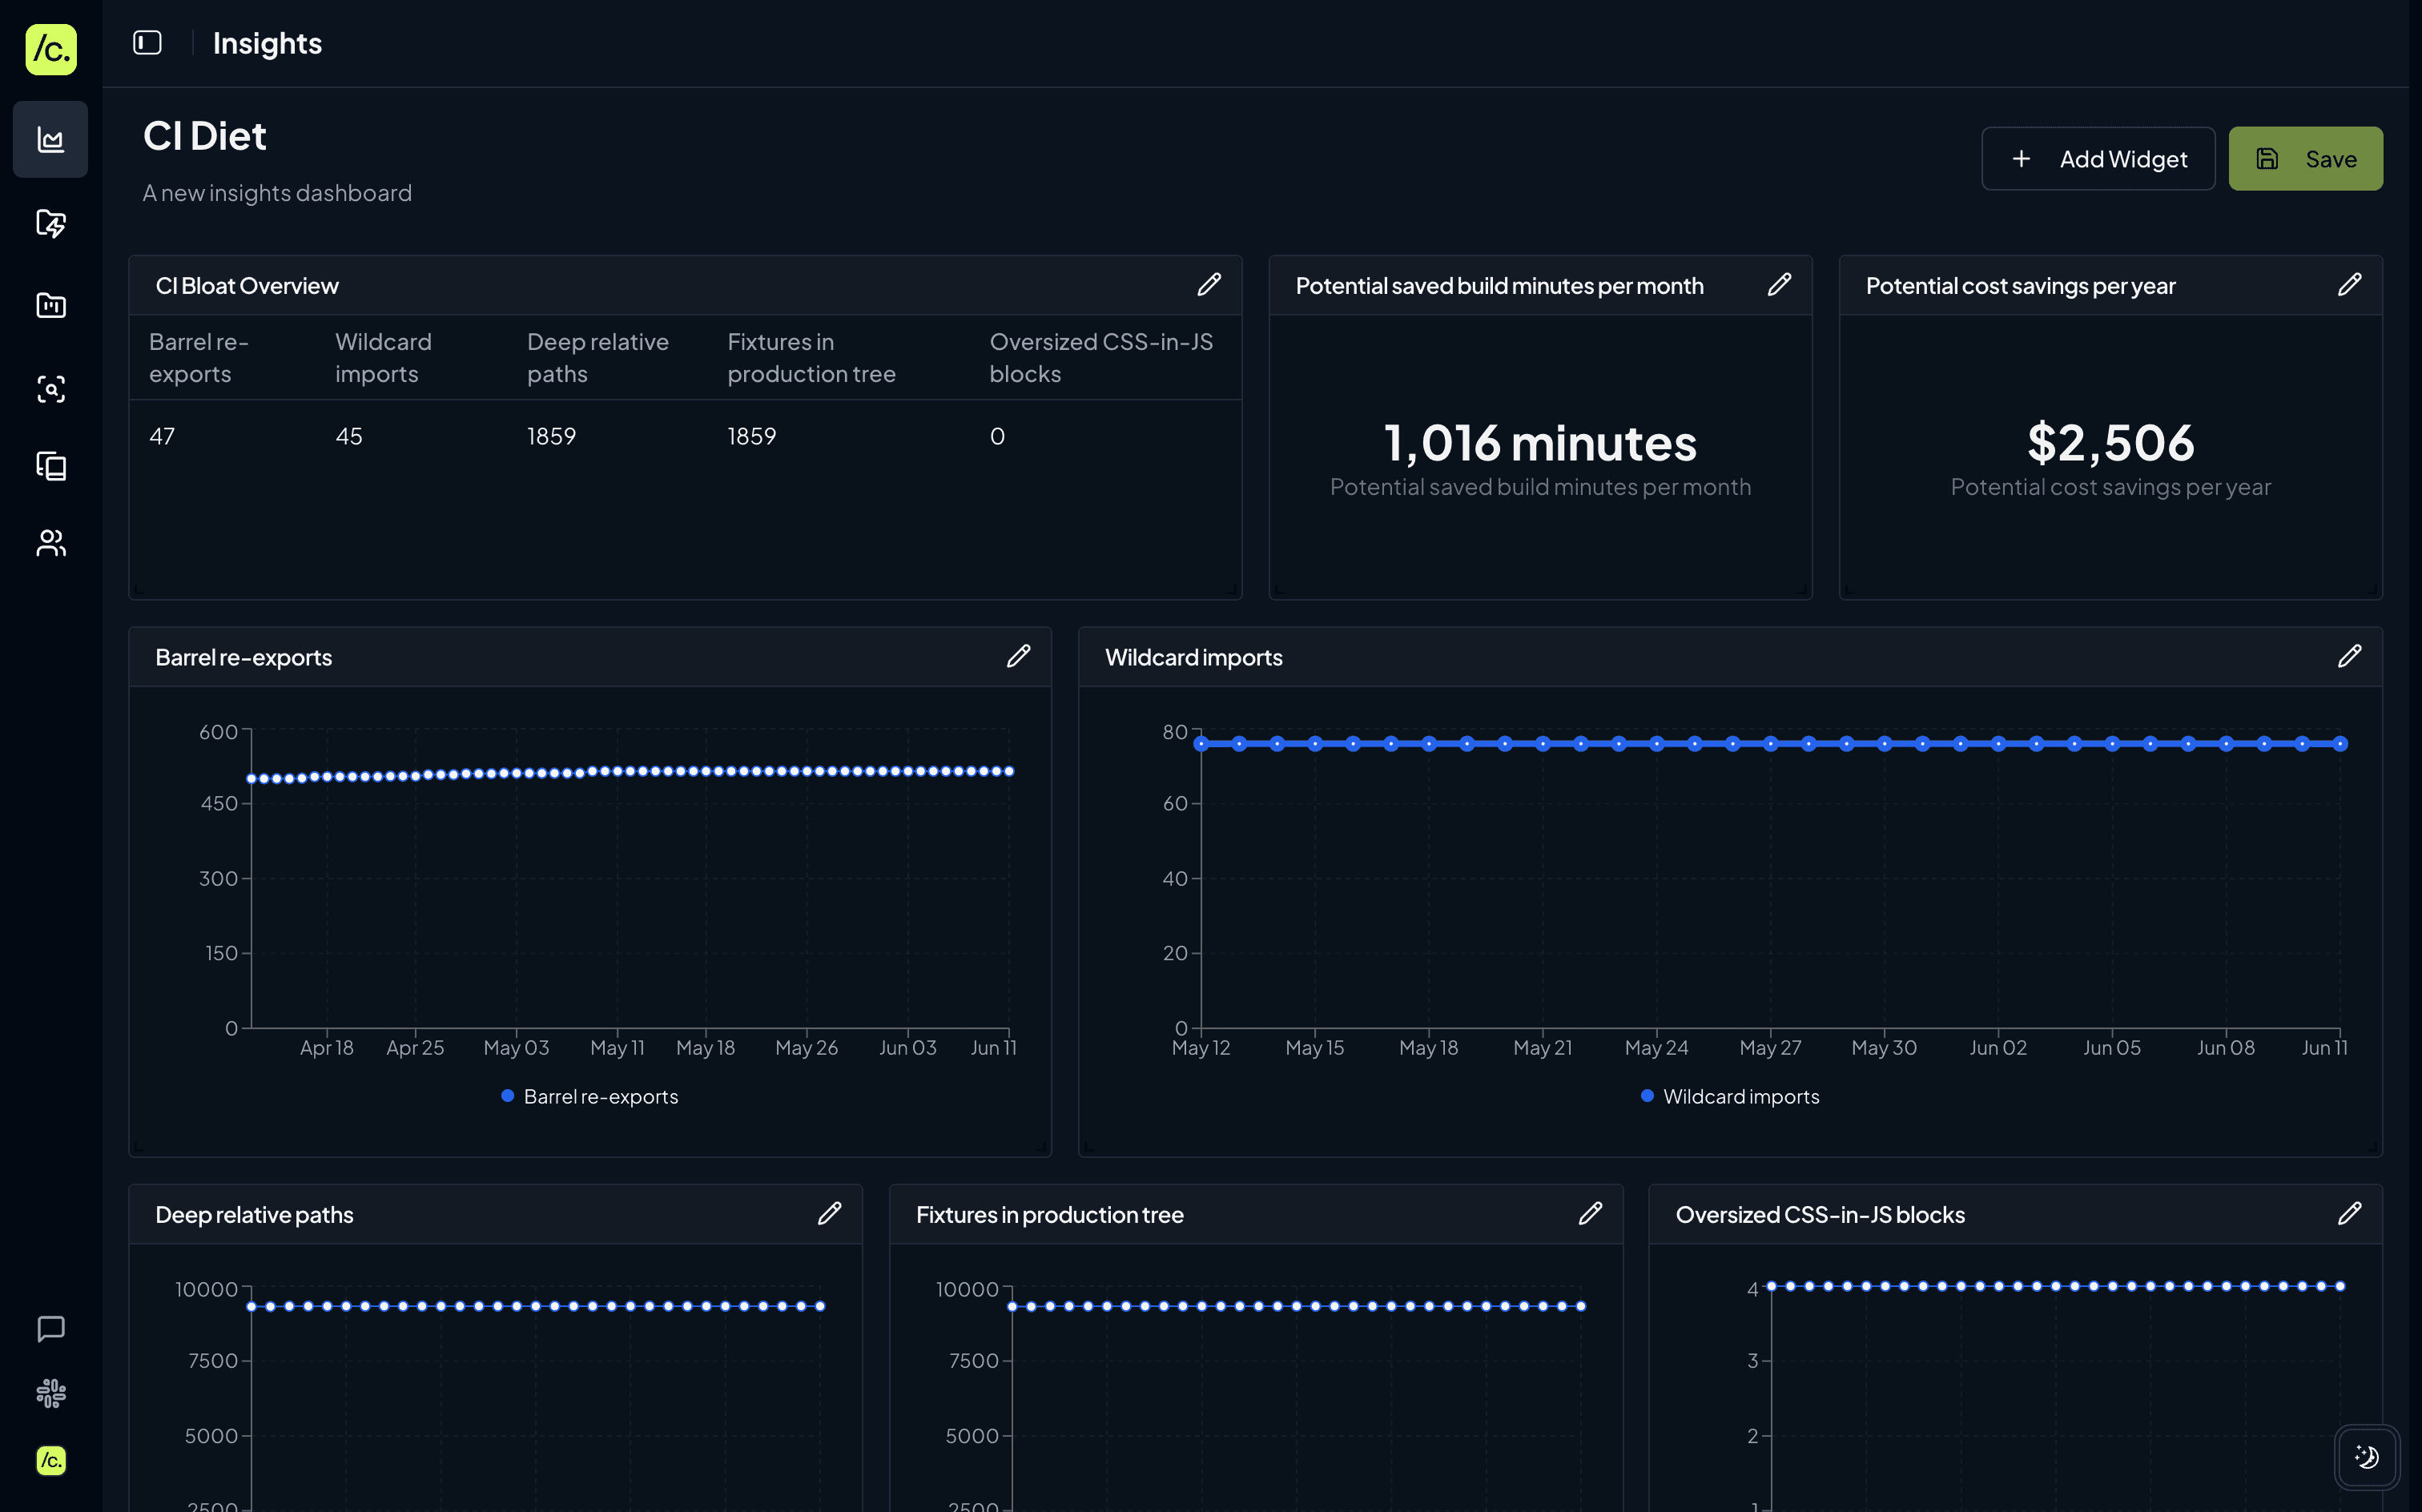
- Spin up a “CI Diet” dashboard in Codemod Insights
- Go to Insights → Create Dashboard and name it
CI Diet. - For each smell below, create a Timeseries widget:
- Rule type:
ast-grep - Edit rule → add ast-grep YAML rule
- Match type:
Match Count(default) - Repo → select your project’s repository
- Query name: use the smell name or any label you prefer
- Optional:
- Group by codeowners
- Filter: add include/exclude glob patterns
- Optional: create one Single-Number widget that holds all five queries (A-E) inside itself, then set the formula to
A+B+C+D+E. That widget will show the aggregate bloat count at a glance.
You now have a chart-per-smell that updates on every push—perfect for sharing progress with the team.
Paste each YAML block into Edit Rule when configuring the widget.
Pattern: export * from "./lib" Open in Codemod Studio
Impact: Touching any file inside the barrel's folder invalidates every downstream import.
Pattern: import * as _ from "lodash", default import of whole libs Open in Codemod Studio
Impact: Pulls whole sub-modules → bigger bundles, more hash misses.
Pattern: ../../../../utils Open in Codemod Studio
Impact: Signals leaky boundaries; more files marked "dirty."
Pattern: __fixtures__/ Open in Codemod Studio
Impact: Large JSON/images counted in production hash.
Pattern: CSS-in-JS blocks > 5 KB Open in Codemod Studio
Impact: Re-computes style hash on every consumer.
Each widget instantly shows how many matches live in the repo commit by commit—no builds required.
Fetch the last 200 successful runs of your main workflow:
Loading code sample...
1. Open Codemod Insights → create a dashboard → add the five ast-grep widgets (barrel, wildcard, deep-path, fixtures, CSS-dup).
2. Sort widgets by match-count so the worst offenders surface first.
3. In your repo:
Loading code sample...
4. For each smell (worst offenders first), look for matches (using Run in CLI in Codemod Studio), refactor it (either manually or by creating a codemod with Codemod Studio), commit, repeat until the count drops.
Loading code sample...
5. Push and open a draft PR:
Loading code sample...
Merge a couple of trivial PRs or re-run the workflow so the new branch accrues ~10 runs—enough to smooth out network variance.
Loading code sample...
Loading code sample...
Example: trimming just 30 s off a pipeline that runs 50 times a week frees ~25 min weekly → ~21 hrs yearly of engineer waiting time.
Run a free Insights scan on your repo, paste the barrel-file rule, and see your first bloat metric in < 10 minutes—free-tier available. Get started now